Technical Analysis 101
Build the chart skills to use with GEX context
Learn how Gamma Exposure (GEX) reveals where SPX and SPY price will accelerate or stall. Understand liquidity shelves, gamma pockets, and dealer positioning.
This guide breaks down GEX in plain English so you can use it to improve your trades.
GEX (Gamma Exposure) measures the total gamma held by market makers at each strike price. Think of this chart as showing you where price moves freely vs. where it gets stuck.
Imagine price is a ball rolling on a surface. GEX shows you where the surface is smooth (ball rolls fast) vs. where there's friction (ball slows down). You want to know what's ahead before the ball gets there.
Market makers (the big players who provide liquidity) must hedge their options positions. This hedging creates mechanical flows that influence price action:
When there's a lot of options positioning at a strike, market makers must actively buy/sell shares to hedge. This creates friction that slows price down.
When there's minimal positioning, market makers don't need to hedge much. Price can move quickly with less resistance.
GEX isn't magic—it's showing you where the order flow from hedging will create natural support, resistance, or acceleration zones.
GEX is based on options open interest. For 0DTE trading, the current day's gamma levels are most relevant as contracts expire.
Positive gamma (green) = dealers hedge by buying dips & selling rips → price stabilizes
Negative gamma (red) = dealers hedge by selling into selloffs & buying into rallies → price accelerates
A GEX chart displays gamma exposure at each strike price. Here's how to interpret what you're seeing:
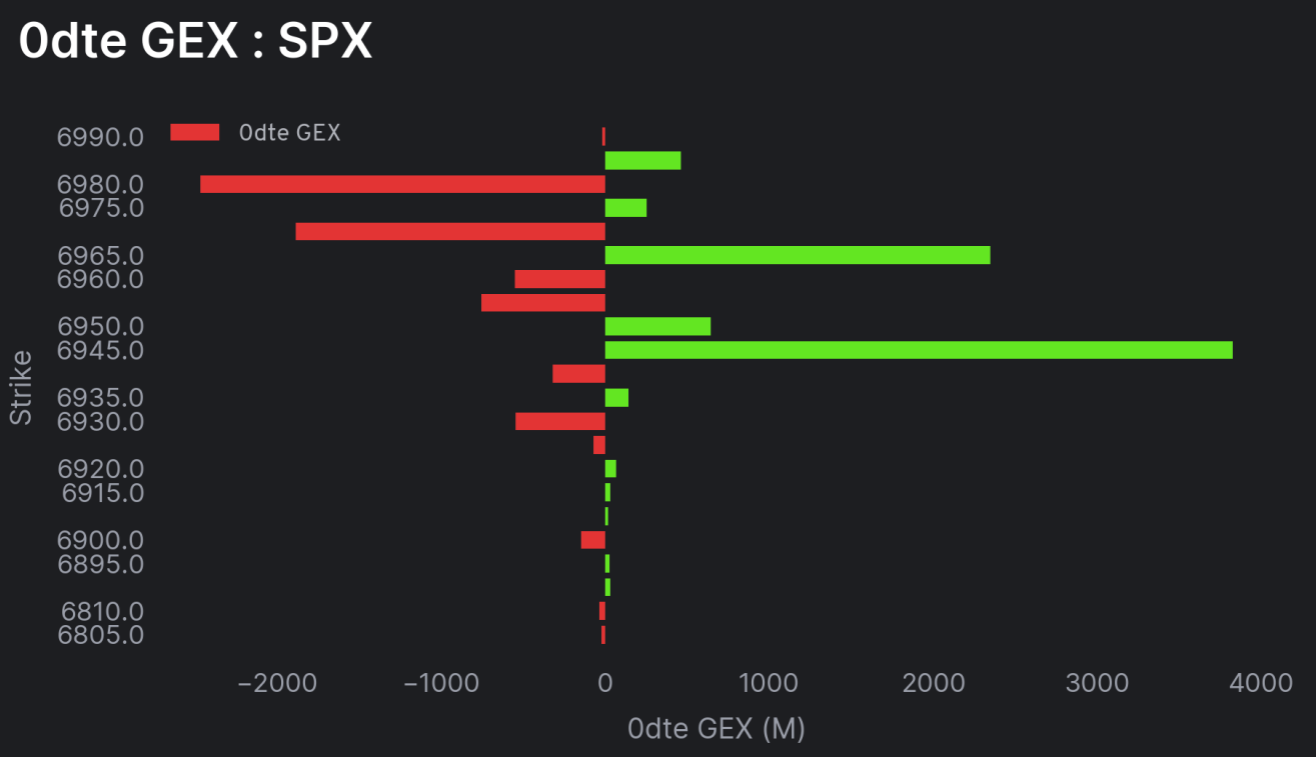
Example 0DTE GEX chart for SPX showing red (negative) and green (positive) gamma bars
The vertical axis shows SPX strike prices. Find where current price is, then look above and below to see what's waiting.
The horizontal axis shows the size of gamma exposure (in millions). Bigger bars = more hedging activity = more impact on price.
Focus on the clusters of large bars near current price. Distant strikes matter less for intraday trading.
A liquidity shelf is a price zone with significant positive gamma (big green bars). This is where dealers are long gamma—their hedging activity stabilizes price.
When dealers are long gamma, they hedge by buying dips and selling rips. This creates a "dampening" effect that slows price movement and encourages mean reversion.
If price is in a positive gamma zone, expect it to stabilize and potentially reverse—fading moves works well here. Great for scalping ranges or taking profits.
If price is running toward a positive gamma zone and you're not already in the trade, don't chase. The stabilizing effect often kills momentum. Wait for the reaction, then look for the next setup.
A gamma pocket is a price zone with significant negative gamma (red bars). This is where dealers are short gamma—their hedging activity amplifies price moves.
When dealers are short gamma, they hedge by selling into selloffs and buying into rallies. This creates a "snowball" effect that accelerates price movement in either direction.
If price breaks into a negative gamma zone, expect expansion—not mean reversion. Let winners run and don't take quick profits. Moves can extend further than expected.
When the overall market is in a negative gamma environment, expect bigger intraday swings. This is when 0DTE moves can really accelerate—both up and down.
We don't trade just because of GEX. We trade from levels and use GEX to understand where price is likely to accelerate or get stuck.
GEX is a context tool, not a signal generator. Here's how to incorporate it into your process:
Start with your technical analysis—support, resistance, VWAP, moving averages, prior highs/lows. These are your trade levels.
Check the GEX chart to see what's at and around your levels:
Positive gamma (green) → dealers stabilize price, expect chop/mean reversion
Negative gamma (red) → dealers amplify moves, expect speed and expansion
Our premium members get daily GEX levels, analysis, and real-time commentary on how price is interacting with gamma zones.
Use code ALPHA30 for 30% off Premium
Let's break down actual GEX charts so you can see these concepts in action:
Positive gamma (green) creates "stabilization zones" where price tends to slow down. Negative gamma (red) creates "acceleration zones" where moves can extend. Plan your trades accordingly—take profits before positive gamma, let winners run through negative gamma.
GEX for Beginners
Utilizing GEX with SPX
Industry standard for GEX data with detailed SPX and SPY gamma exposure analysis. They pioneered retail access to this data.
Options flow and gamma data with a clean interface. Has free tiers and social features for tracking whale activity.
While not GEX-specific, their community shares gamma indicators and scripts. Great for overlaying GEX levels on your charts.
We post daily GEX analysis in our free Discord with premium commentary for members.
Our free guide on options fundamentals, Greeks, and how gamma works at the contract level.
Trading psychology guide for managing emotions when trades don't go your way.
GEX (Gamma Exposure) measures the total gamma held by market makers at each strike price. It shows where dealers need to hedge their options positions, which directly impacts how price moves at different levels.
Green bars (positive gamma) indicate liquidity shelves where price tends to stabilize. When dealers are long gamma, they hedge by buying dips and selling rips, which dampens volatility and causes price to slow down or mean-revert.
Red bars (negative gamma) indicate gamma pockets where price can accelerate. When dealers are short gamma, they hedge by selling into selloffs and buying into rallies, which amplifies moves and causes trends to extend.
No. GEX is a context tool, not a trade signal. Use GEX to understand WHERE price is likely to accelerate or stall, then combine it with your technical levels and trade setups for entries.
A liquidity shelf is a price zone with significant positive gamma (green bars) where dealers are long gamma. Their stabilizing hedging activity (buying dips, selling rips) causes price to slow down, chop sideways, or mean-revert at these levels.
A gamma pocket is a price zone with negative gamma (red bars) where dealers are short gamma. Their amplifying hedging activity (selling into selloffs, buying into rallies) causes moves to accelerate and extend quickly.
GEX data typically updates daily based on options open interest and positioning. For 0DTE trading, pay special attention to the current day's gamma levels as they're most relevant.
Join traders who use GEX context to improve their entries, exits, and expectations.
Less than one winning trade
Cancel anytime • Secure checkout via Whop
Just want to look around? Join free →